Statistical tracks
boxplot
A boxplot track shows numerical data as box plots. It reads the same files as the numerical tracks, bigWig or bedGraph. The view is divided into windows a few pixels wide (5 pixels by default). For each window, the track draws a box from the first to the third quartile of the values in it, a line at the median, and a vertical line showing the spread of the values. This gives a quick sense of how variable a signal is along the region, which a bar chart of averages hides.
Add a boxplot track
Adding a boxplot track is the same as adding a numerical track, except that you choose boxplot as the track type:
- Open Tracks > Remote Tracks.
- In Track Type, choose boxplot — show numerical data as boxplots (in the Stats group).
- Paste the URL of the bigWig file, or of the bgzip-compressed and tabix-indexed bedGraph file, in File URL.
- Check the Assembly, type a Track Label if you like, and click Add Track.
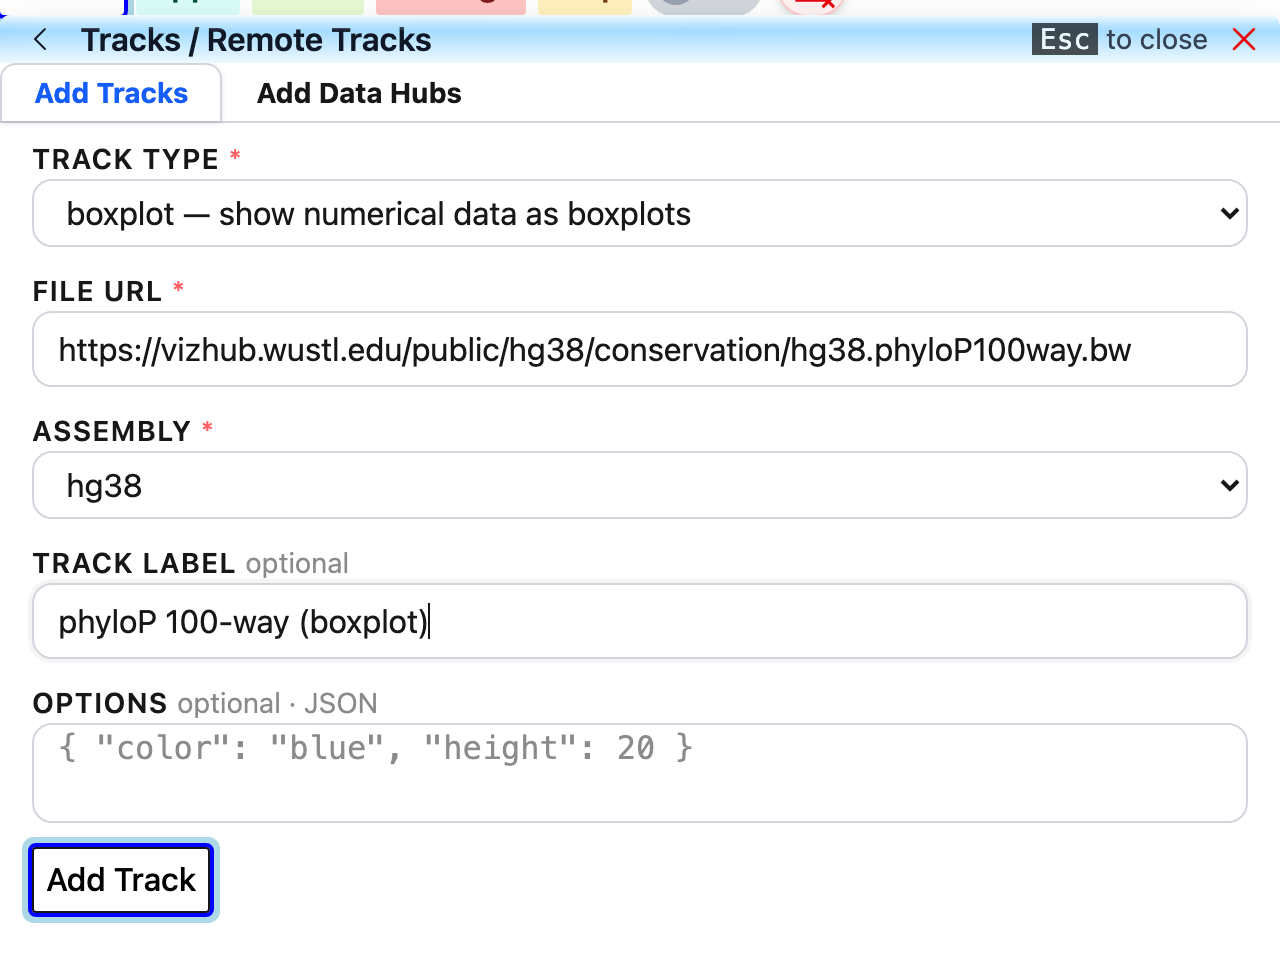
The example uses the hg38 phyloP 100-way conservation scores, https://vizhub.wustl.edu/public/hg38/conservation/hg38.phyloP100way.bw. The new track appears at the bottom of the track list:

In a datahub, give the track "type": "boxplot":
{
    "type": "boxplot",
    "name": "phyloP 100-way",
    "url": "https://vizhub.wustl.edu/public/hg38/conservation/hg38.phyloP100way.bw"
}
Options
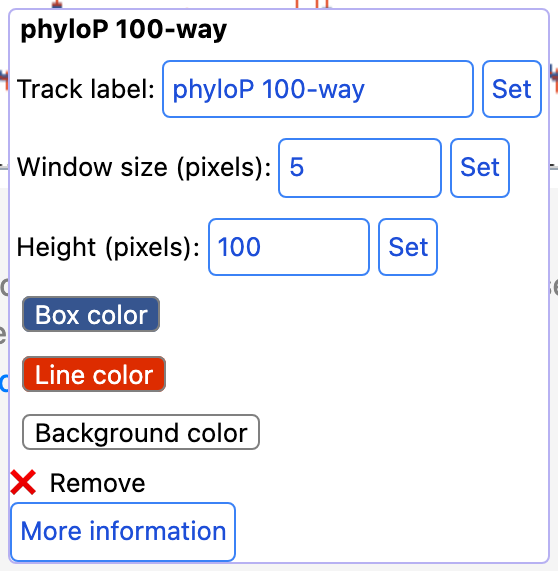
Right-click the track to open its menu. You can change the Track label, the Window size (pixels) of each box, the Height (pixels) of the track, the Box color, the Line color (median and whiskers) and the Background color.